
Once a study is enrolling, monitoring happens in two places: the study dashboard, which summarizes the whole cohort, and the Participants workspace, which lets you drill into individual, pseudonymous participants. Everything you see is de-identified — participants appear as study-scoped IDs like P-0001, never as names or contact details. See Privacy and de-identification for how that separation works.
The study dashboard#
The study dashboard is the operational home for an active study. It shows the study identity (name, status, visibility, study type, principal investigator, created date, protocol number, and NCT number) alongside the live operational picture:
- Enrollment progress, assessment completion, and withdrawal count.
- Average study day — how far through the protocol the cohort is, on average.
- Health signals and attention-needed items — participants whose data suggests the team should look closer.
- Study metrics charts.
- The recruitment funnel, when campaigns exist.
- Wearable cohort status — how much of the cohort is connected and syncing.
- Recent activity.
Common actions sit at the top of the dashboard: Share Invite to share the study invite code, Export Study to export data, Configuration to open the Study Builder, and Participants to open the participant list.
The participants table#
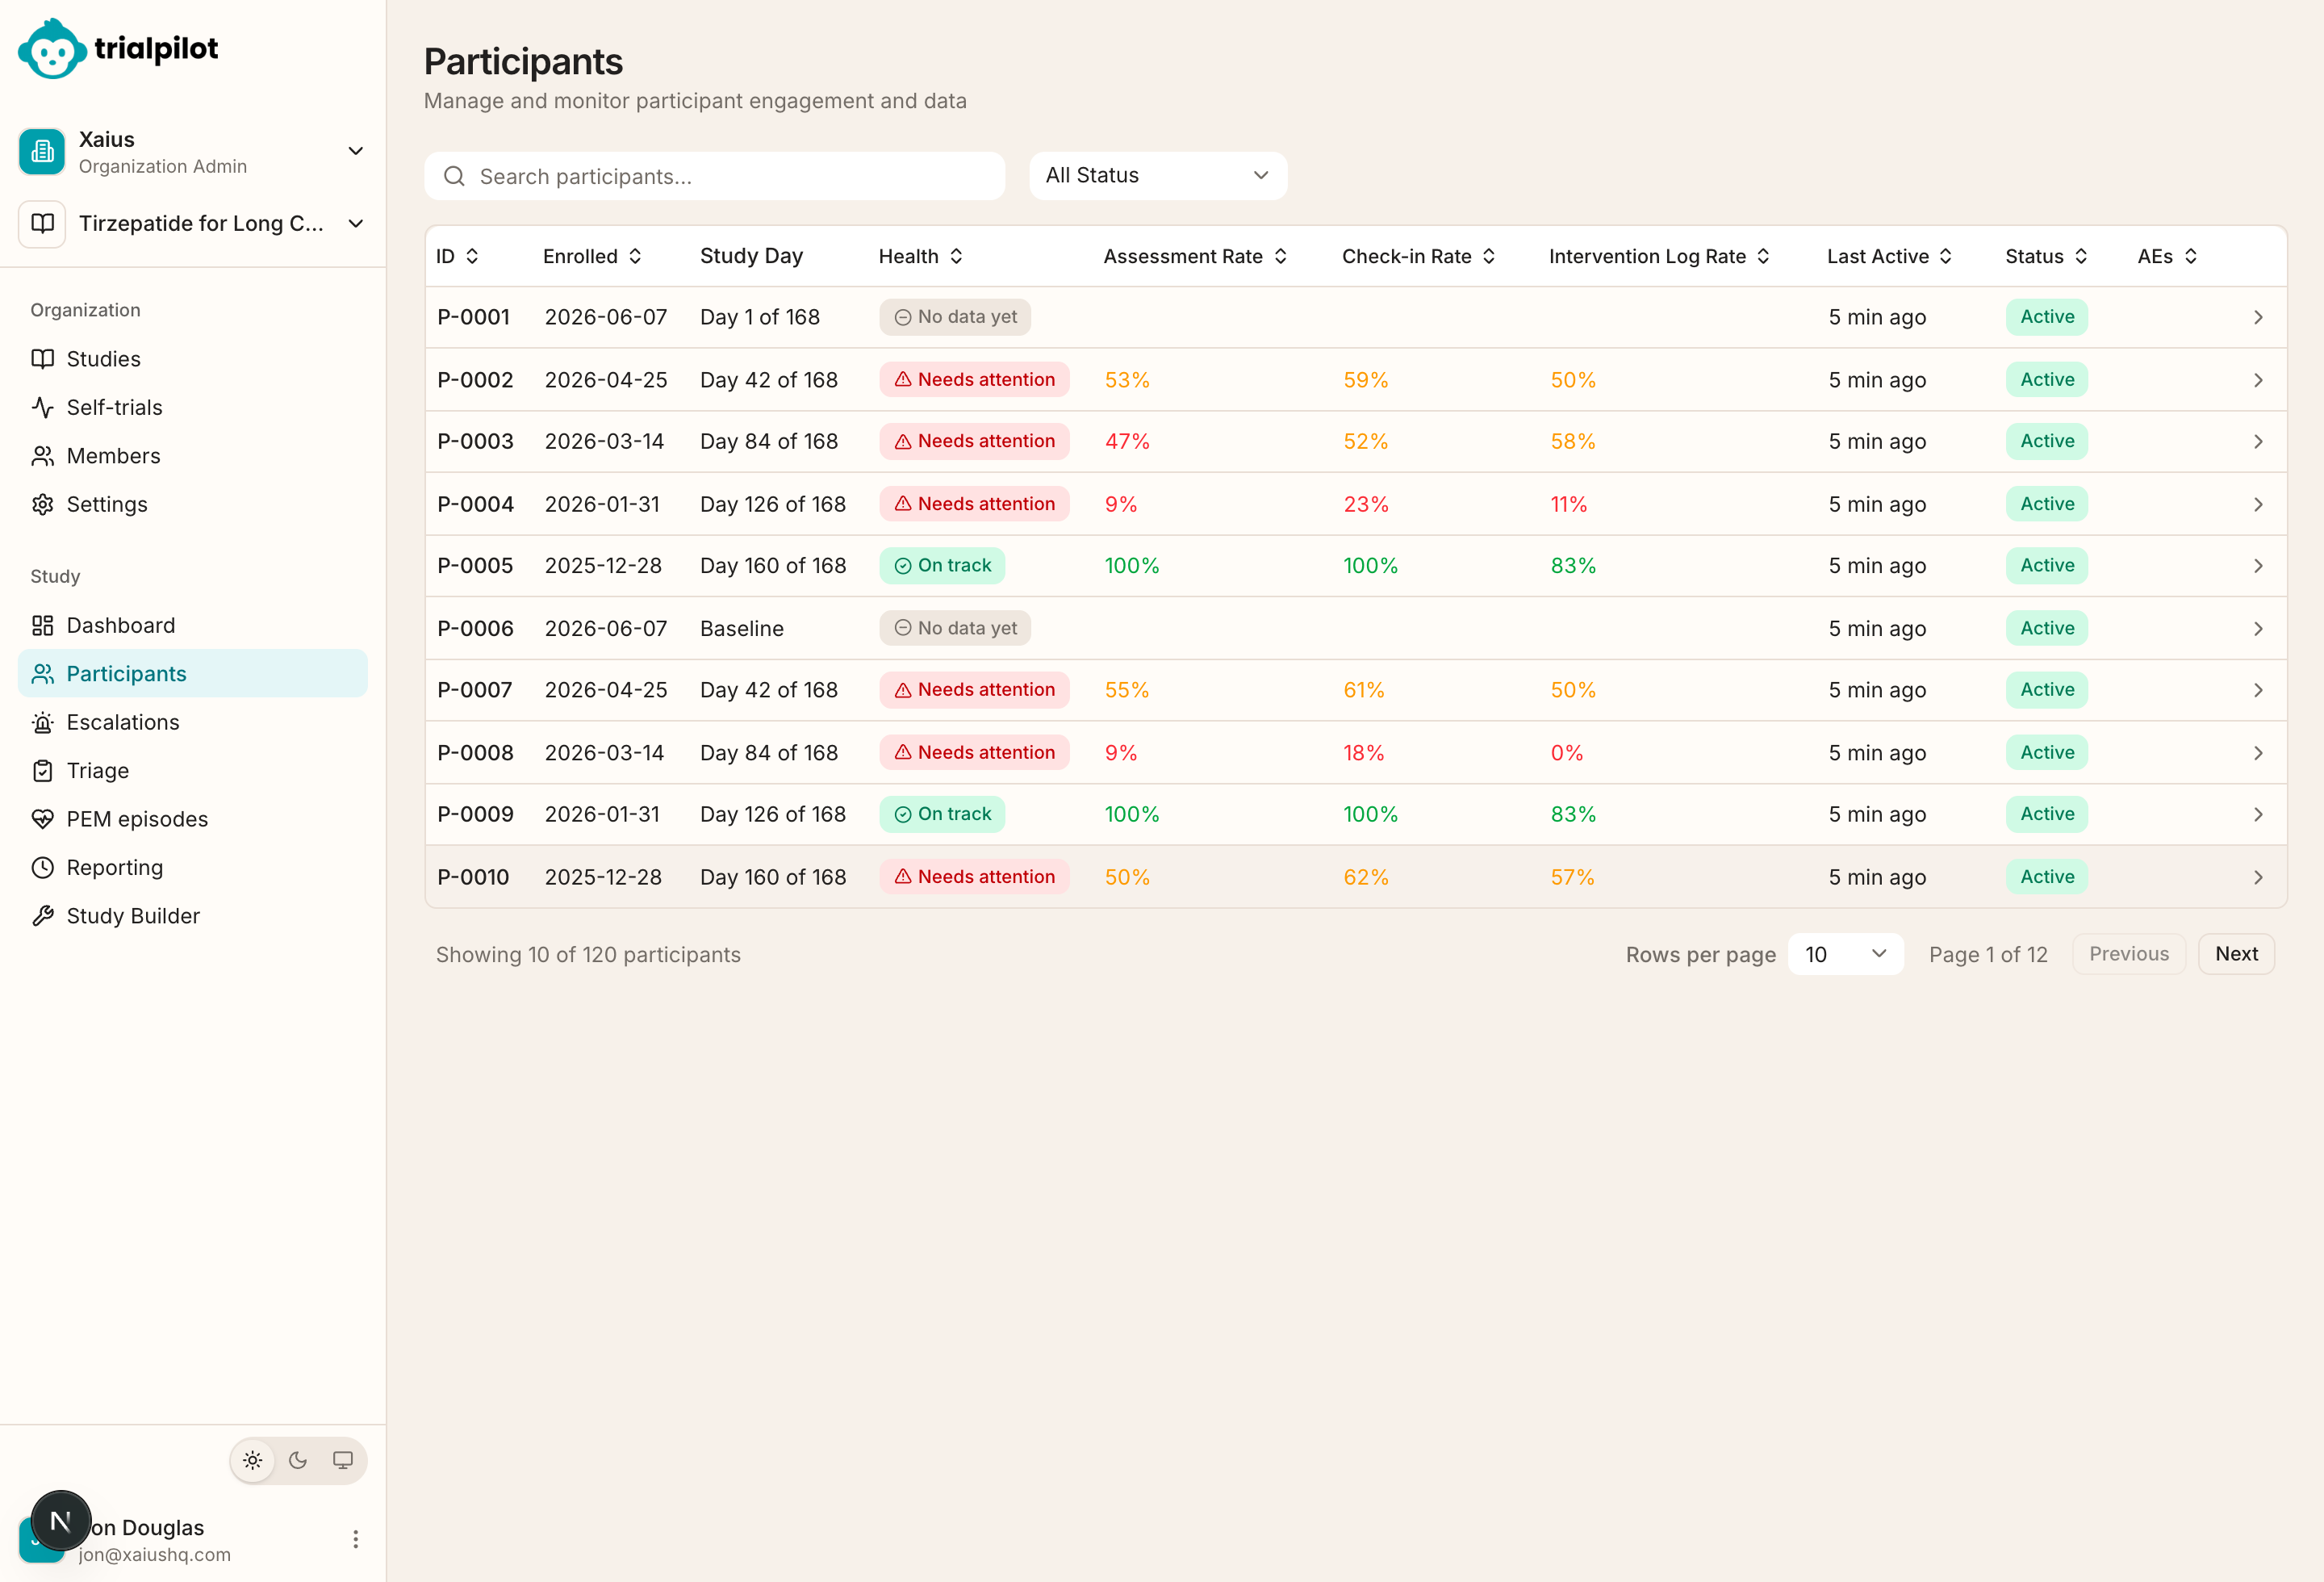
Open Participants to monitor engagement and de-identified study progress across the cohort. Each row is one participant:
| Column | What it shows |
|---|---|
| Participant ID | The study-scoped pseudonymous ID. |
| Enrollment date | When the participant enrolled. |
| Study day | Current day in the protocol for that participant. |
| Health status | Current health signal for that participant. |
| Completion rates | Assessment completion rate, daily check-in rate, and intervention log rate. |
| Wearable status | Whether a wearable is connected and syncing. |
| Last active | The last time the participant was active. |
| Status | Enrollment status for that participant. |
| Adverse events | Adverse event count for that participant. |
You can search the table, filter by status, filter by wearable state, sort any column, and open a participant's detail page.
Participant detail#
A participant detail page uses the study-scoped ID, such as P-0001, and organizes that participant's data into tabs:
- Overview
- Status, verification state, demographics bands, plan status, compliance, baseline symptoms, symptom trends, app engagement, and a wearable summary.
- Daily Check-Ins
- Day, date, overall score, individual symptom values, and the PEM flag for each check-in.
- Assessments
- Assessment name, status, score, completion time, and duration.
- Interventions
- Day, date, dosage, and confirmation status.
- Wearable
- Connected devices, metric trends, and data coverage.
- PEM episodes
- Detected post-exertional malaise episodes for that participant.
The page also shows a health headline when one is available, a participant safety section, and gentle check-in controls when available.
Gentle check-ins#
Where available, the participant page offers a gentle check-in (nudge) control: a considerate, one-way, rate-limited check-in a coordinator can send when a participant has gone quiet. It is designed for a chronically ill population — missed days are expected clinical signal, not lapses, so the check-in is framed as care rather than a compliance reminder.
Wearable cohort coverage#
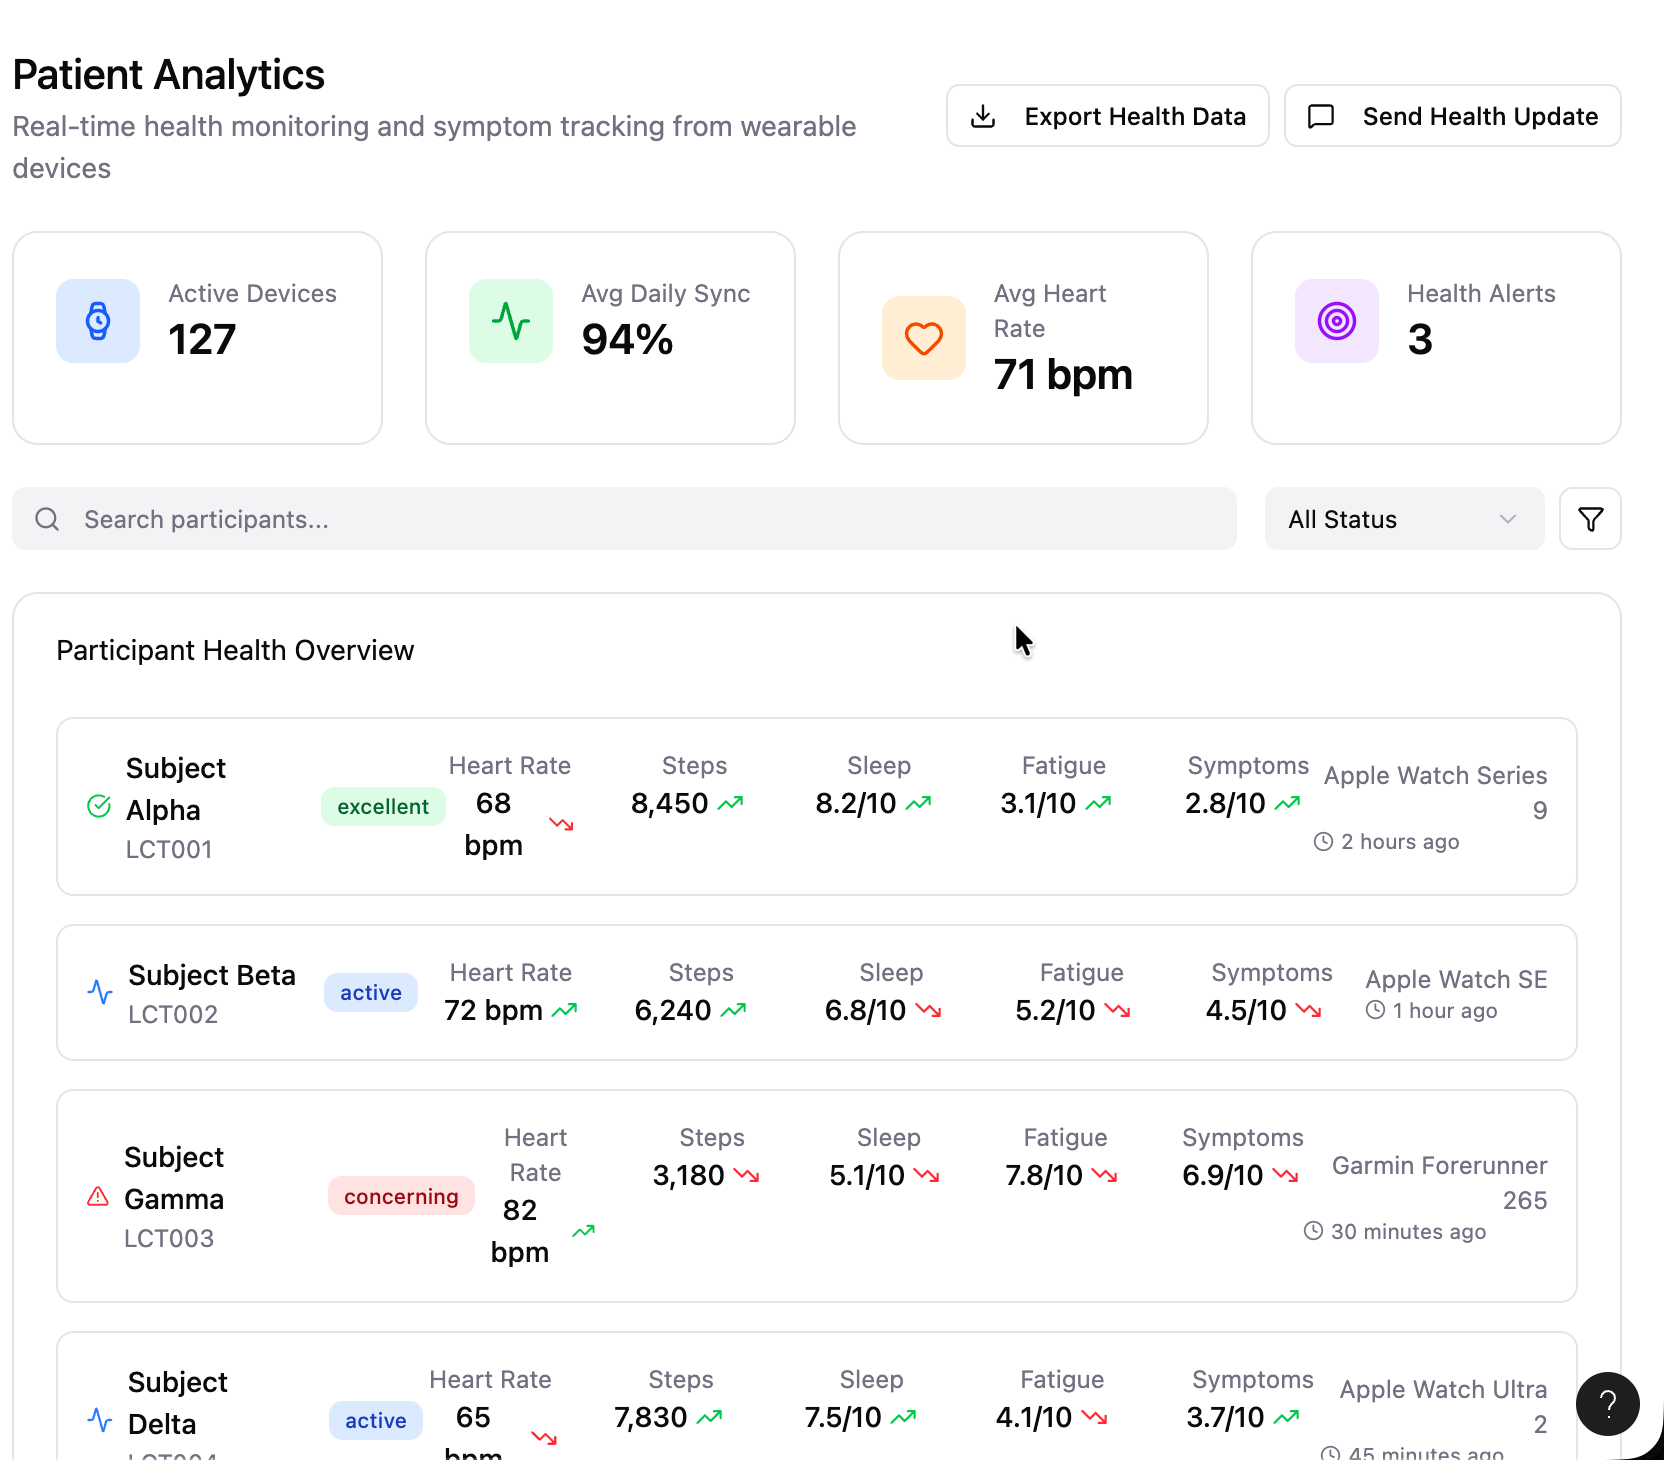
Wearable data quality is a cohort-level property: a study that depends on heart rate or activity data needs most of the cohort connected and syncing. The dashboard's wearable cohort status and the per-participant wearable state in the table and detail tabs together show where coverage gaps are.
PEM episodes#
Open Participants > PEM episodes to view post-exertional malaise crashes — the delayed symptom worsening after exertion that characterizes conditions like ME/CFS and Long COVID — detected from daily check-ins, wearable data, and in-app PEM capture. Episodes are shown by participant pseudonym and can include severity, source, and affected symptom domains.
PEM detection is exploratory
Risk by site#
When a study has sites, the risk board adds a By site of record table. Missing data, stale contact, visit adherence and deviation load are recomputed for the participants each site oversees, with the same thresholds as the study board. Participants without a site get their own row, so nobody drops out of view.
Operational performance#
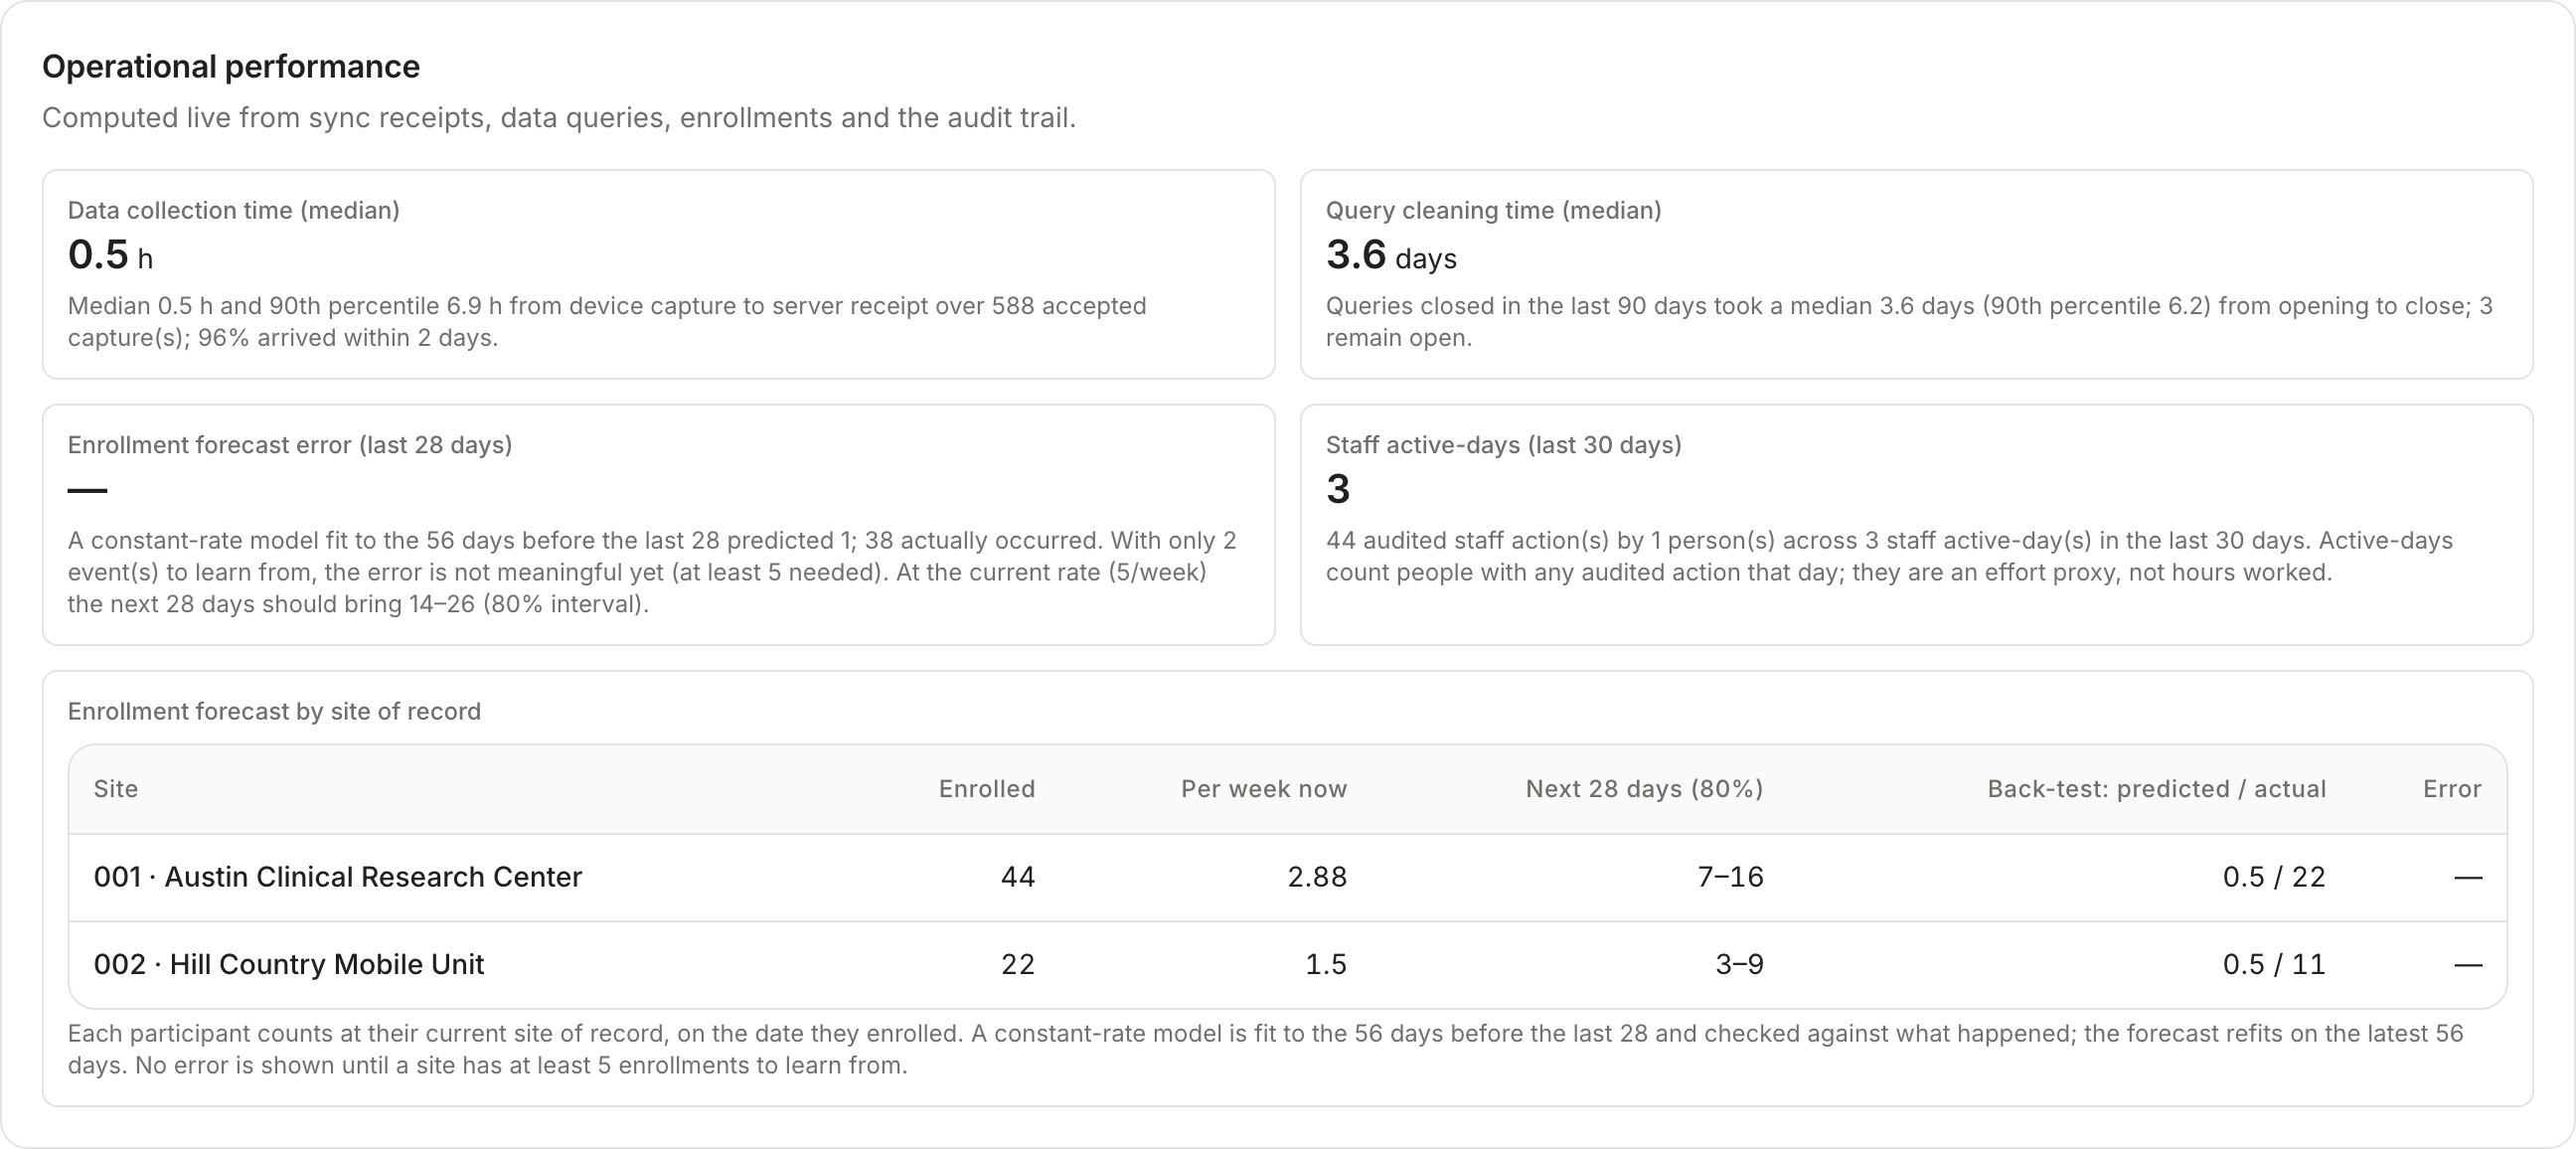
The Operational performance card measures how the study runs, computed live from records TrialPilot already keeps. Each number comes with a plain-language basis, and a number stays blank until there is enough data to mean something.
| Measure | What it tells you |
|---|---|
| Data collection time | How long data takes from the participant's device to the server. |
| Query cleaning time | How long data queries take to close. |
| Enrollment forecast | A constant-rate forecast checked against what actually happened, for the study and for each site. Platform studies add each arm, for unblinded roles. |
| Staff active-days | How many people did audited work on how many days. An effort proxy, not a timesheet. |
| Dataset build | Hours from the data cut to the hard lock to the first submission export, or the time elapsed while a build is open. |
| Interim decision turnaround | For platform studies, hours from each interim cut to the SAC package, its release to the DSMB, the recommendation and the executed decision. |
Small-cohort suppression#
Individual-level views are suppressed while the cohort is small, because a handful of rows plus a little context can re-identify someone even without names:
- Participant-level researcher views — the participants table and detail pages — are suppressed until the study has at least 20 participants.
- Participant-level recent activity on the study dashboard may be hidden until the study reaches the same 20-participant threshold.
Cohort-level summaries remain available throughout. The reasoning behind the threshold is covered in Privacy and de-identification.